The Invesp Blog
Maximize Your Website’s Potential: Your ultimate guide to boost conversions, improve user experience, increase search engine rankings, and skyrocket e-commerce sales.
Join our community of digital marketers and entrepreneurs for proven strategies and data-driven insights.
Latest
- 24 Apr
- 9 minutes
Reading Time: 9 minutes Mobile commerce, or m-commerce, is steadily emerging as the future of online shopping or shopping. It’s changing the way we browse, select, and purchase products. With sales projected to hit a staggering $2.52 trillion in 2024, it’s clear that this digital revolution is not just a passing trend but a seismic shift in consumer behavior. […]
A/B Testing
Conversion Optimization
- Conversion Optimization, conversion rate optimization
- 19 Oct
- 8 minutes
- Conversion Optimization, email subject lines
- 23 Sep
- 8 minutes
- Conversion Optimization Strategy, conversion strategy, CRO Plan, CRO strategy
- 31 Aug
- 10 minutes
Join 25,000+ Marketing Professionals!
Subscribe to Invesp’s blog feed for future articles delivered to your feed reader or receive weekly updates by email.
Business
- Direct Mail, Direct Mail Conversion Rate
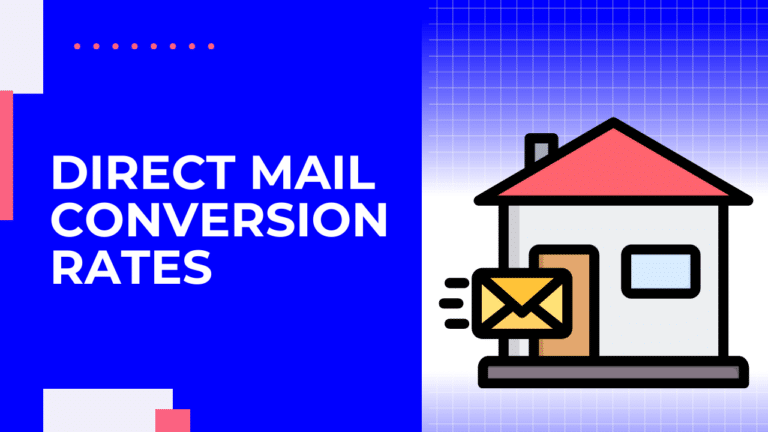
- 29 Nov
- 5 minutes
Blogging
- General, Intermediate, persuasive copywriting, Resource
- 23 Apr
- 27 minutes
- outreach guide
- 5 Sep
- 11 minutes
- email list, email subscribers
- 24 Mar
- 12 minutes
Copy Writing
Join 25,000+ Marketing Professionals!
Subscribe to Invesp’s blog feed for future articles delivered to your feed reader or receive weekly updates by email.
Ecommerce
Infographics
- visual search, visual search statistics
- 7 Jan
- 2 minutes
- video marketing
- 17 Aug
- 2 minutes
- social media customer support
- 9 Aug
- 2 minutes
- SaaS pricing, SaaS pricing Stats
- 6 Jul
- 2 minutes
Landing Pages
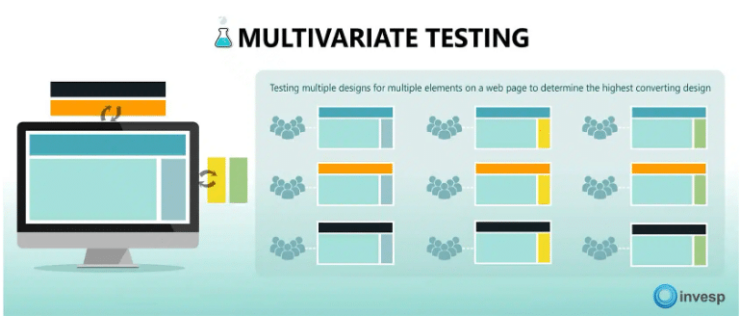
Multivariate Testing
- AB testing, multivariate testing, Testing Strategies
- 6 Mar
- 10 minutes
- AB testing, Expert, General, Resource
- 9 Apr
- 13 minutes
Join 25,000+ Marketing Professionals!
Subscribe to Invesp’s blog feed for future articles delivered to your feed reader or receive weekly updates by email.
Sales and Marketing
Shopping Cart
- abandonment, Beginner, cart abandonment, Ecommerce, How-to, shopping cart abandonment
- 11 Jan
- 7 minutes
- abandonment, advertising, Ecommerce, email, Facebook, How-to, Intermediate, online-marketing, PPC, retargeting, shopping cart abandonment, user experience, ux
- 14 Jul
- 5 minutes
- abandonment, Beginner, checkout, conversion rate optimization, Ecommerce, ecommerce product pages, free shipping, online chat, online shopping, shopping cart abandonment statistics, usability
- 9 Dec
- 4 minutes
- abandonment, Conversion Optimization, Ecommerce, increase-conversion-rate, increase-online-sales, increase-site-conversion-rate, Intermediate
- 26 Feb
- 6 minutes
Social Media
- Beginner, General, List, Social Media, social media conversion rates
- 2 Nov
- 5 minutes
- Beginner, General, infographic, Statistics
- 27 May
- 2 minutes
Webinars
Join 25,000+ Marketing Professionals!
Subscribe to Invesp’s blog feed for future articles delivered to your feed reader or receive weekly updates by email.